This week I'm pressing pause on my University of Florida and position groups analyses and trying something new.
Some of the best college football statistical analyses this side of the Harvard Sports Analysis Collective are actually from a blog known as Mr. SEC (gasp!). Their "By the Numbers" series introduces several novel metrics for understanding teams' offensive and defensive performances.
His metrics "quick strike," "slow grind," and "quick sand" are all extremely useful and interesting, but they've yet to have been applied to any schools except for the SEC. I'd like to change that.
My next mini-series will adapt each of these metrics for the B1G starting with the Quick Strike. The Quick Strike
measures how easily a team can score points.The stat is a simple one. Take a team’s total number of points scored. Divide that number by the number of plays an offense runs… and there’s your points-per-play ratio, your Quick Strike number.This isn’t just a measure of offense, however. Obviously, non-offensive points are counted in this as well. Special teams and defensive plays also help to set up offenses with short fields.
Simple enough.
I collected my B1G data on points and number of offensive plays for the period 2008-2011 from the ever-useful CFBStats. The results are both interesting and useful.
Just as Mr. SEC discovered, the Quick Strike (QS) scores are highly correlated with success. For instance, in 2011 the four highest QS scores are Michigan St, Michigan, Nebraska and Wisconsin, which happen to be the Big Ten teams with the most overall wins.
I also tested this by conducting a linear regression between quick strike scores and wins for the 2008-2011 seasons and found similar results:
| Wins | Coefficient | t | p |
|---|---|---|---|
| Quick Strike | 22.131 | 5.83 | 0.000 |
Essentially all this means is that the QS metric is a great at predicting which teams will win. The table above indicated that with 95% confidence we can say that a one unit increase in QS would cause a team to win 22 more games. In practice, however, this means that a .1 increase in QS means a team (on average) can expect to win 2.2 more games per year. In short, the ability to score quickly is useful for winning games (duh).
| School | Quick Strike | wins and Losses |
|---|---|---|
| Ohio State | 0.3940520446 | 6-7 |
| Michigan State | 0.4617021277 | 11-3 |
| Michigan | 0.5130331754 | 11-2 |
| Nebraska | 0.4192477876 | 9-4 |
| Wisconsin | 0.6595517609 | 11-3 |
| Purdue | 0.3779697624 | 7-6 |
| Illinois | 0.3223684211 | 7-6 |
| Indiana | 0.2954022989 | 1-11 |
| Northwestern | 0.3821138211 | 6-7 |
| Penn St | 0.2817059484 | 9-4 |
| Minnesota | 0.2970430108 | 3-9 |
| Iowa | 0.4138728324 | 7-6 |
The QS score can actually be read as number of points scored per play run. So Ohio State averaged ~.4 points per play run while Wisconsin hit almost .66 points per play.
Now that we've established that, let's get to some more in-depth observations.
the good
Wisconsin and Ohio State have easily been the two most consistent teams in the Big Ten.
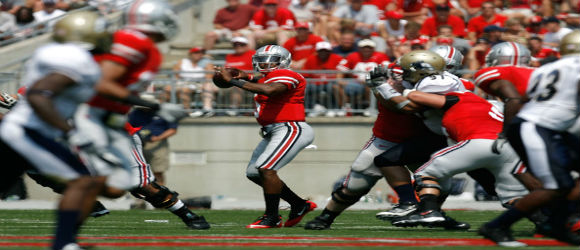
Ohio State's offense averages 0.458 points per play, which is about .07 points per play higher than last year's QS. Say what you will about Pryor, the offenses under his command were consistently able to rank among the top 3 in points per play.
Also good (and funny) is the fact that Michigan's 2008 offense was only able to put up a .307, which was good enough to barely beat out Indiana for second-to-last place in the conference.

the bad
Really the worst news is that Michigan is getting consistently better each year since 2008. From .307 they've steadily increased each year, now up to .51 points per play.
Now that Michigan has a half-competent defense again, The Game looks to be a tough one from here until the end of the present coaching era.
the random observations
Ohio State's 2011 QS score was actually good enough for sixth in the conference last year, which is pretty horrifying for the conference. As we might expect, Wisconsin's deadly power run game simply tore up the QS rankings, with about a .15 point lead over the second-place Michigan.
One of the recurring results from 2008-2011 was how much Wisconsin is going to miss Paul Chryst. New coordinator Matt Canada brings a pretty solid résumé, but Chryst really had Wiscy rolling year after year.
Also random is the fact that Northwestern runs an astounding number of plays per year - we're talking almost 200 more plays than Ohio State each year.
I will say one criticism of the QS measure is that it intentionally penalizes teams that consistently score on most offensive possessions, but take 10 plays to do so each drive. You can either go 80 yards in one Braxton-to-Devin Smith bomb or get three yards per carry (and a cloud of dust) by running up the middle each play - as long as the end result is 6 points.
However, I think we've all been frustrated with inept 2-minute drills in the waning seconds of games before, so this metric is certainly useful for capturing that big play potential.

