The search for the One, True, Most Perfect Single Statistic to analyze the strength and efficiency of offenses and defenses has recently come down to a debate between two YPPs: yards per point and yards per play.
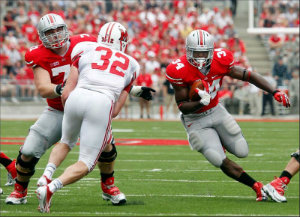
 Hyde was a big reason for the offense's efficiency
 Ed Feng describes the latest volley in the fight by Tim Chou at the Sloan Sports Analytics Conference:
football coach Tim Chou proposed Yards Per Point as this essential metric for football. For offense, take yards gained and divide by points scored. On offense, lower values for Yards Per Point mean a more efficient offense. This unit tends scores touchdowns instead of field goals after long drives.
...In his talk, Chou showed that the difference in Yards Per Point (defense minus offense) correlated strongly with winning percentage in college football. Hence, Yards Per Point is a good efficiency metric to judge a football team.
Yards per point and yards per play aren't the only two big measures of efficiency. Points per play is also a widely-used metric by both Football Outsiders' S&P+ and Mr. SEC, who calls the statistics "quick strike" and "slow grind" for offense and defense.
These hopefully sound familiar to you by now, as I've tracked the Buckeyes' quick strike and slow grind numbers for the past few seasons.
Feng argues that the correlation between early and late season yards per point values is weak, random, and doesn't isolate a single unit, indicating that random events like turnovers play affect yards per point throughout the season. Instead, Feng argues that yards per play is a better efficiency metric for both offense and defense.
Each statistic has its strengths and weaknesses, so it's worth taking a look at which best described the Buckeyes' offense in 2012.
If you take these three variables – yards, points, and plays – and combine them, you are left with the metrics described above. The table below uses these three metrics to describe the Buckeyes' 2012 offense. The number in parentheses is the Buckeye offense's rank.
| Yards Per Point | yards per play | Points per play | |
|---|---|---|---|
| 2012 Buckeyes | 11.4 (4th) | 6.08 (33rd) | .516 (9th) |
There’s obviously a huge discrepancy in the rankings between the yards per point and points per play on the one hand and the yards per play on the other. While the Buckeye offense was near the top of the pile in the former two metrics, Braxton and company lagged behind on yards per play.
While initially confusing, this actually tells a fairly coherent story about the Buckeye offense.
Yards per point is closely related to red zone efficiency, meaning that teams with low yards per point scores generally score touchdowns more often than field goals. These teams minimize the number of yards it takes to get each point.
 Herman is probably calculating these stats in his head
Similarly, a team with a high points per play has few negative plays, generally gaining yards with each down and getting touchdowns from drives instead of turnovers, field goals, or punts.
On the other hand, yards per play measures efficiency, but does not take turnovers into account. A team might rank near the top of the country in yards per play but still not be an effective offense due to turnovers, field goals, or poor red zone percentage. After all, points win games – not yards.
However, which metric (or two metrics) best describe the Buckeyes last season?
The rankings above seem to indicate that the Buckeyes were very efficient with their drives without necessarily racking up yards.
The Buckeye offense was fourth and ninth in the country in the two points related metrics, but 33rd in yards per play. This view is corroborated by the Buckeyes’ stellar red zone percentage – 88% – which was eighteenth in the country.
In my opinion, it is necessary to see all three of these metrics side by side to get the full picture of the Buckeye offense from last season. The offense was generally efficient in translating long drives into touchdowns, but it also had a fair number of three and outs, which drove down its yards per play values.
What do you think? Does one measure – YPPoint, YPPlay, or PPP – make more sense to you? Next week I'll take a look at the defense numbers for each metric to try and better understand the defense's performance.

