One of the great things about sports over the last 20 years or so – beyond the anticipation and actual playing of the games – is the explosion of statistics and availability to them as a means to further feed our insatiable appetite for all things college football, or more specifically, Ohio State football.
One must absorb statistics with caution however as it's often possible to use the same set of stats to bolster varied arguments or even put too much emphasis on one particular statistic without understanding the cause/effect relationship of other stats thus causing a misguided view or an overreaction to data.
Still, it's the offseason and what are we here for if not to make mountains out of molehills for the purpose of fostering discussion?
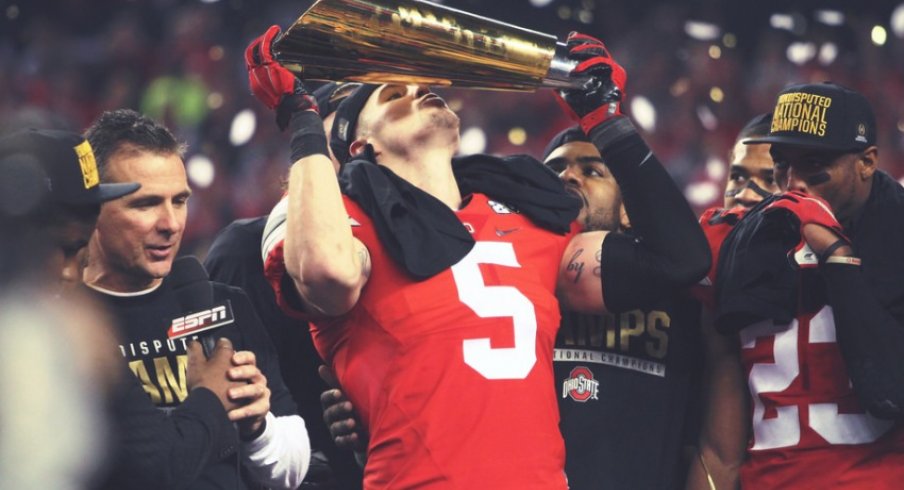
With that said, and knowing Urban Meyer and staff are poring over statistics even more intensely than you despite winning it all, here are some data points from the magical run to the title that could potentially use some bolstering if the Buckeyes wish to enhance their chances at a repeat.
FUMBLES LOST - NATIONAL RANK: 112
Citro smothered this topic just last week so you should already be well-informed on the trainwreck that was Ohio State's collective ball security.
Last year, the national champions lost an amazing 14 fumbles in 15 games. Only eight FBS teams lost more: Iowa, BYU, SMU, Louisville, UConn, Navy, West Virginia and Eastern Michigan.
The good news is Ezekiel Elliott in particular stands to fare better with ball security this fall since he'll finally have use of both hands following wrist surgery.
INTERCEPTIONS THROWN - NATIONAL RANK: 62
Considering Ohio State was forced to insert a reserve with zero collegiate snaps under his belt with just days to prepare following Braxton Miller's season ending labrum tear into the starting role then had to resort to a 3rd-stringer after said reserve broke his ankle against Michigan, it's not hard to believe the Buckeye signal-callers ranked just 62nd in combined interceptions thrown.
J.T. Barrett was the chief culprit as he tossed 10 interceptions in 314 attempts while Cardale Jones added two in 92 throws. Combined, the duo threw for 41 touchdowns against those 12 picks so it wasn't the end of the world but making better decisions in the passing game to complement an effort to reduce fumbles should help the Buckeyes move the needle in both of these first two statistical categories.
Doing so would be huge as it's hard to automatically assume the defense will be as opportunistic as last year as they gained 33 turnovers, good for fifth best in the nation, leading to six defensive touchdowns, good for second best in the land, helping offset some of those offensive miscues.
FIRST DOWNS DEFENSE - NATIONAL RANK: 94
It's no secret teams moved the ball on Ohio State's defense last year.
Some of that was offset by the crazy amount of turnovers the unit created and some of it didn't matter because the offense was cranking out 44.8 points per game, but again, knowing it's dangerous to bank on turnovers from season to season, giving up nearly 19 first downs per game (283 total) is an area of opportunity for a team looking to repeat.
RED ZONE DEFENSE - NATIONAL RANK: 77
One of the most troubling stats from last year, the defense struggled mightily to keep teams from scoring once they reached the red zone. Ohio State tied with Kent State for 77th in the nation in the metric allowing scores on 38 of 45 trips (84.4%) inside the 20 including 31 touchdowns against only seven field goals.
Against the trio of Oregon, Alabama and Michigan State, the Buckeye defense gave up 11 scores in 13 red zone possessions including nine touchdowns.
Even if the defense doesn't fare much better percentage wise this fall, it would at least be nice to see them force field goals at a higher rate.
3RD DOWN CONV DEFENSE - NATIONAL RANK: 16
It might seem odd to see this stat listed considering the Bullets ranked 16th in the country but there seems to be room for improvement when you consider their 34.4% success rate was good for just 5th in the Big Ten behind Wisconsin, Penn State, Michigan State and Nebraska.
Also, as mentioned earlier, it might be hard for the defense to post another 33 turnovers gained so forcing teams to punt more often and/or earlier in possessions could end up being more important than last year.
PENALTIES PER GAME - NATIONAL RANK: 50
Yes, we all want to watch Ohio State play an aggressive style and with that sometimes comes penalties but an average of 5.6 per game is something this year's team should strive to improve upon.
The Buckeyes racked up 84 flags in 15 games a season ago, ranking seventh in the league.
RUN DEFENSE - NATIONAL RANK: 34
For a program that has long been successful in stopping the run, the Buckeyes simply haven't lived up to the set standard the last few years.
Last season, the Bullets gave up an average of 141.3 yards per game on the ground on 3.95 yards per with 24 touchdowns. In the month of November alone the defense gave up an average of 180.8 yards rushing over five games though they did tighten up over the final three games yielding 124.3 yards on 3.66 per carry.
DISHONORABLE MENTION
- 4th Down Conversion Defense ranked 64th in the country as the Bullets surrendered a fresh set of downs 10 times in 19 tries.
- Kickoff Returns, despite all the burners on the roster and Urban's love for special teams, ranked just 29th in the land with an average of 22.72 yards per return.
- Punt Return Defense posted what seems like a decent 5.80 yards per return but that was only good for 38th in the country.
- Sacks Allowed finished at 49th in the country with an average of 1.87 per game.
With the plethora of statistical categories out there, it's impossible for even the best of teams not to have a handful of weaknesses. That said, which of these worries you the most or the least, and why, as it relates to Ohio State's chances of repeating as national champions?


