Welcome to Inside the Box Score, where we delve into the box score of the last game and highlight some interesting stats and trends across Ohio State seasons and across the country.
There were few if any superlatives in the box score against Oklahoma. We'll start today's feature by shaming the Buckeyes' defense before we move to questioning some trends in the offense over the past few years.
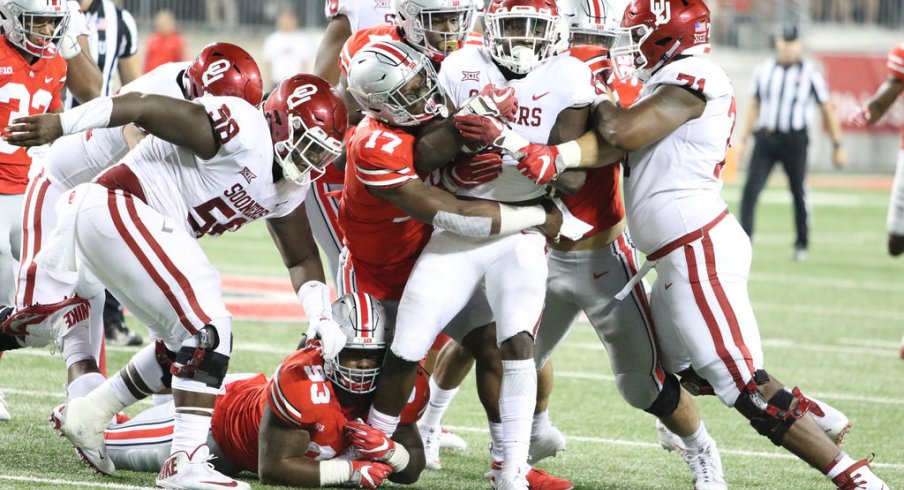
A Game to Forget for Ohio State's Defense
Ohio State conceded 490 yards of offense to Oklahoma. The Sooners could've reached 500 on the last drive if it wanted to force the issue rather than run out clock.
| Year | Opponent | Yards Per Play | Yards | Outcome |
|---|---|---|---|---|
| 2014 | Cincinnati | 8.12 | 422 | W, 50-28 |
| 2013 | Clemson | 7.58 | 576 | L, 35-40 |
| 2013 | Michigan | 7.35 | 603 | W, 42-41 |
| 2017 | Oklahoma | 6.81 | 490 | L, 16-31 |
| 2014 | Michigan State | 6.78 | 536 | W, 49-37 |
| 2011 | Michigan | 6.63 | 444 | L, 34-40 |
| 2008 | Ilinois | 6.59 | 455 | W, 30-20 |
| 2014 | Oregon | 6.55 | 465 | W, 42-20 |
| 2013 | Wisconsin | 6.54 | 399 | W, 31-24 |
| 2012 | California | 6.48 | 512 | W, 35-28 |
| 2014 | Indiana | 6.27 | 395 | W, 42-27 |
| 2012 | Indiana | 6.17 | 481 | W, 52-49 |
| 2012 | Nebraska | 6.15 | 437 | W, 63-38 |
| 2013 | Iowa | 6.15 | 375 | W, 34-24 |
| 2016 | Wisconsin | 6.08 | 450 | W, 30-23 |
| 2009 | Navy | 6.00 | 342 | W, 31-27 |
The 490 yards Ohio State's defense conceded fell short of the absolute worst Ohio State's defense has ever done: 659 yards to Illinois in 1980. It's among the recent worst, though, for all games in which Ohio State's defense conceded at least six yards per play.
Ohio State fans should lament Oklahoma's yards per play as much as the overall yards conceded. The Sooners' ability to pick up big yards in bunches muted any optimism Ohio State fans may have felt after J.K. Dobbins' third-quarter touchdown run. The four-play, 92-yard drive was particularly ghastly to watch as well.
Ohio State's Pass Defense is a Windsock on a Tire Fire
Last year Ohio State replaced almost its entire secondary with new faces and a new coach and had lightning in a bottle. This year so far, Ohio State replaced almost the entire secondary and the results have been disastrous.
It's so bad, by the way, that Ohio State is dead last in the country in passing defense after two games. The Buckeyes' 403 yards conceded through the air are worst 13 yards per game worse than the next worst, Nebraska.
| Rank | School | Passing Yards Per game |
|---|---|---|
| 126 | Texas A&M | 377.5 |
| 127 | North Carolina | 378 |
| 128 | South Alabama | 385.5 |
| 129 | Nebraska | 390 |
| 130 | Ohio State | 403 |
Simple passing yards per game stats can be interpreted a few ways. For example, Ohio State concedes so many yards per game because Indiana and Oklahoma are pass-happy offenses that are eager to burn Ohio State's back seven through the air. This means that we can attribute some of Ohio State's atrocious pass defense numbers to the volume of attempts against it. The 51.5 attempts over two games is No. 128 in the country ahead of just New Mexico and Connecticut (56 each).
Ohio State's yards-per-attempt statistics look only a little better than the worst. Indiana and Oklahoma averaged 7.8 yards per attempt against Ohio State's defense. The worst in the country is UTEP's 11.6 (both share the common Oklahoma opponent).
However, Ohio State's 7.8 yards per attempt on defense is No. 93 in the country right now. That won't win championships.
Ohio State's Passing Offense is the Sick Man of the Big Ten
Ohio State mustered 183 yards passing on Saturday. 40 of those passing yards came on the last drive of the game when the outcome was already decided. It was grim to all Ohio State fans that watched who knew Oklahoma dared Ohio State's passing game to beat it deep and Ohio State could never call the Sooners' bluff.
Over the past three-plus seasons, Ohio State's passing attack has gradually fallen below the Big Ten average. The Buckeyes had great success through the air in the national championship season in 2014. Ohio State only had one game that year—the overtime win at Penn State—in which the passing production fell well behind what was the season average for the 13 other members of the Big Ten.

Ohio State's passing output by game (in scarlet) compared to the Big Ten season average (in blue).
Fortunes for the passing game turned south after then. Nine of the 13 games in the 2015 season fell below the season average for the 13 other members of the Big Ten. The home loss at Michigan was the clear nadir in which the Buckeyes mustered just 45 yards through the air.
The trend continued in 2016 and 2017. The Buckeyes had six games in 2016 below the Big Ten passing average and the 143 yards Ohio State mustered before the final drive against Oklahoma on Saturday falls well short of the current season average for the 13 other members of the Big Ten.
Ohio State's passing game has been in clear decline since the 2014 season. The causes for it are multiple and overdetermined. However, the trend is clear even as Ohio State remains one of the best rushing teams in the conference and country.
I'm Sensing a Pattern...
There's been one constant across J.T. Barrett's career. Even as he's cycled through three offensive coordinators in his four years, some with offensive philosophies that clearly downplay the QB run threat (like Kevin Wilson), he's found himself in positions where's asked to run the 2007 Florida Gators offense.
It makes you think.
Meyer pledged that his 2011 sabbatical and discussions with coaches like Dabo Swinney and Chip Kelly led him to rethink his offensive philosophy to shy from leaning too much on the quarterback as a run threat, his recent teams have found him resorting to this bad habit again.

Ohio State did well to lean on Ezekiel Elliott to lead the way for the rushing offense.
Here's the balance between quarterback rushing attempts and running back attempts in 2014. Ohio State generally found a good balance in dividing carries between quarterbacks and running backs (predominantly Ezekiel Elliott). The Virginia Tech game, incidentally the season's only loss, stands as an exception to a healthy balance in the rushing offense.
The 2016 season (and two games in 2017) show much greater variance than the 2014 season. You'll see Ohio State generally found balance and, importantly, leaned on the running backs for the rushing offense in the blowout wins against the likes of Bowling Green and Rutgers.
")
There is much greater variance in how much Barrett has accounted for Ohio State's rushing attempts in a game since 2016.
As the offense sputtered, Ohio State's play-calling looked more to Barrett to generate yards on the ground. Contrast the percentage of rushing attempts by the quarterback for Barrett against Maryland with the percentage against the likes of Michigan State (17-16 win), Michigan (30-27, double-overtime win), and Clemson (31-0 loss).
The loss to Oklahoma, in which Barrett accounted for 53% of the team's rushing attempts despite the availability of Dobbins and Weber, squares well with this pattern.