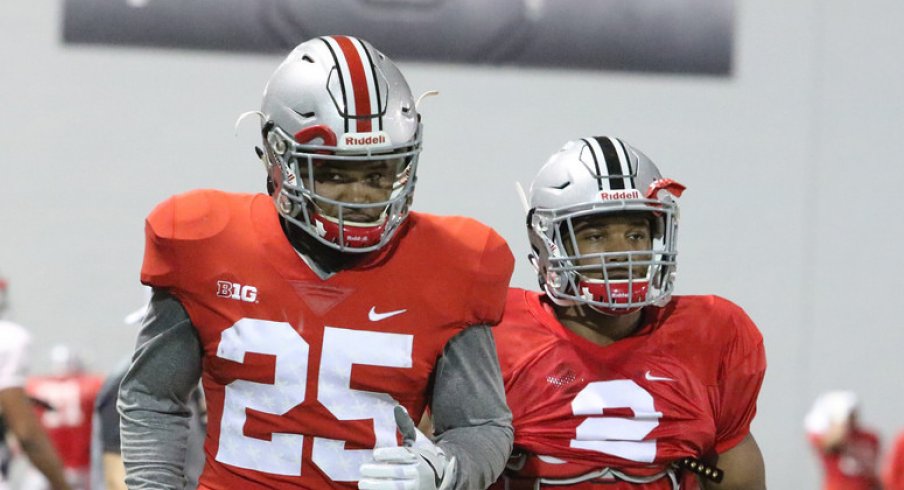
Mike Weber returned to Ohio State's backfield despite draft-eligibility and the potential to transfer to another program where he could command more attention as the premier back. He did this with assurances from the coaching staff that the nature of the offense would change with J.T. Barrett graduated and that he and Dobbins could combine to be the kind of rushing tandem Ohio State has not had since 1998.
This builds in an assumption that Ohio State fans should want a 1A/1B tailback tandem where either could be "the guy" but both ultimately share carries. It recalls famous "thunder and lightning" backfields like Auburn had in 2004 or USC had in 2005. In other words, backfields in which two star backs each get an equal distribution of yards and both rush for more or close to 1,000 yards give offenses a considerable edge that makes their teams great.
A descriptive analysis of Ohio State's rushing data since 1946 does not lend confidence that legendary backfields like USC had in 2005 are indicative of a larger pattern for the Buckeyes. The data show seasons in which yards were spread more equally are generally bad seasons for Ohio State in which the Buckeyes could not find or could not settle on a true No. 1 back. The implications are Ohio State fans should hope either Dobbins or Weber emerge as the No. 1 back and get most of the carries notwithstanding the previous discussion surrounding Weber's return.
The data come from all Ohio State individual statistical summaries for rushing yards as compiled by sports-reference.com. The data start from 1946 and end with the most recent season in 2017. Eddie George had the most rushing yards in a given season in this data with 1,927. The fewest rushing yards for a back that otherwise led the team in rushing was Ollie Cline's 332 rushing yards in 1947.
| Rank | Season | Player | Yards | Rank | Season | Player | Yards |
|---|---|---|---|---|---|---|---|
| 1 | 1995 | Eddie George | 1927 | 72 | 1947 | Ollie Cline | 332 |
| 2 | 2014 | Ezekiel Elliott | 1878 | 71 | 1959 | Bob Ferguson | 371 |
| 3 | 2015 | Ezekiel Elliott | 1821 | 70 | 1951 | Vic Janowicz | 376 |
| 4 | 1984 | Keith Byars | 1764 | 69 | 1966 | Bo Rein | 456 |
| 5 | 1974 | Archie Griffin | 1695 | 68 | 1987 | Vince Workman | 470 |
| 6 | 2007 | Beanie Wells | 1609 | 67 | 2004 | Lydell Ross | 475 |
| 7 | 1973 | Archie Griffin | 1577 | 66 | 1963 | Matt Snell | 491 |
| 8 | 1982 | Tim Spencer | 1538 | 65 | 1950 | Walt Klevay | 520 |
| 9 | 2013 | Carlos Hyde | 1521 | 64 | 1967 | Jim Otis | 530 |
| 10 | 1996 | Pepe Pearson | 1484 | 63 | 1952 | John Hlay | 535 |
Thereafter, I select the top two rushers in any given season. Doing so has a few advantages for our purposes. One, it's a direct test of the proposition that two backs sharing production equally is good for the offense. It's also agnostic about the volume of yards as backs have generally accrued more yards over time as seasons have expanded in length. Further, it selects out rushers that skew the data because they were either 1) reserves who did not get meaningful playing time beyond a few carries or 2) were passing quarterbacks that accrued sack yards.
In a corollary table, I select the top four rushers in a given season as a middle ground between maximum inclusion and selecting just the top two rushers. Selecting the top two rushers or top four rushers has no real bearing on the presentation to follow though selecting the top four adjusts the y-intercept upward as more rushers are evaluated and, intuitively, drop-off becomes inevitable.
The statistics that I report are Gini coefficients. Those trained in economics should recognize this statistic given its prominence in measuring income inequality either between or inside countries. Capturing the area underneath the curve when everyone in the population has equal "income" (or, here: equal rushing yards) versus the actual distribution of the data, the measure is bound between 0 and 1 where higher values indicate higher inequality (i.e. one person has all the rushing yards) and lower values indicate a more equal distribution in which everyone has the same rushing yards.
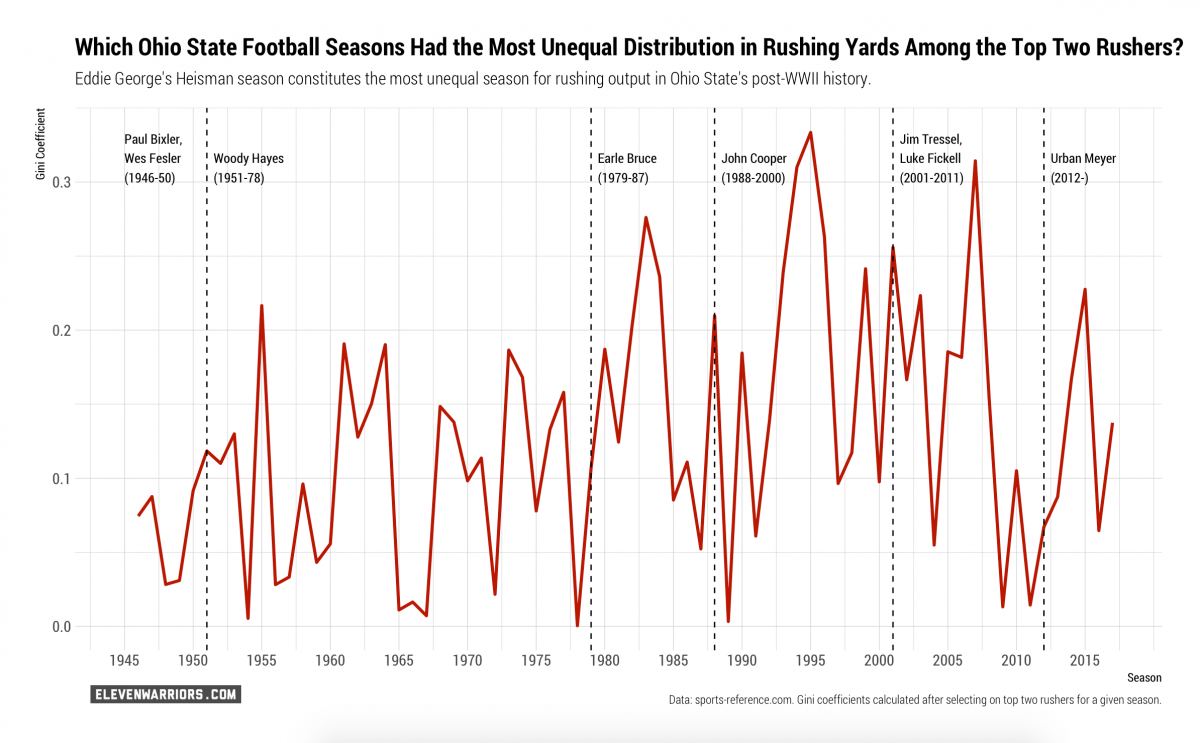
The line-chart below shows the Gini coefficients calculated for each of these seasons and do not lend support to the idea Ohio State should strive to have an equal distribution of rushing yards among its top backs. The seasons in which Ohio State has done that have generally not been great. Conversely, Ohio State is better when it has one true back to ride.

Only Woody Hayes' 28-year tenure offers a slight anomaly in this trend. Hayes' second most evenly distributed rushing attack among the top two backs came in 1954 in which Hopalong Cassady led the team with 609 rushing yards and Bobby Watkins added 596 yards. The Buckeyes were undefeated national champions that year. Watkins graduated after that season, leaving Cassady as the primary rushing option in 1955 in what would be the most "unequal" rushing season among the top two backs in Hayes' tenure. Ohio State took a step back in 1955, losing two games. However, Cassady accounted for 51% of the team's rushing yards among the team's top four rushers that season and graduated with a Heisman Trophy.
Even then, the 1978 season offers a clear illustration of the intuition here. The 1978 season stands out as the most evenly distributed rushing attack in Ohio State's post-war history. Paul Campbell led all backs with 591 rushing yards. Quarterback Art Schlichter had 590 rushing yards. The No. 3 and No. 4 backs, Ron Springs and Ricardo Volley, had 585 rushing yards and 439 rushing yards. The No. 1 back was separated from the No. 2 back by a yard, and the No. 3 back by six yards. 152 yards separated No. 1 and No. 4 in Ohio State's backfield.
| Rank | Season (Gini, Top 2 Rushers) | Season (Gini, Top 4 Rushers) |
|---|---|---|
| 1 | 1978 (.0004) | 1978 (.052) |
| 2 | 1989 (.003) | 1987 (.083) |
| 3 | 1954 (.005) | 2011 (.109) |
| 4 | 1967 (.007) | 1947 (.133) |
| 5 | 1965 (.011) | 1959 (.141) |
| 6 | 2009 (.013) | 1962 (.141) |
| 7 | 2011 (.014) | 2004 (.145) |
| 8 | 1966 (.016) | 1971 (.146) |
| 9 | 1972 (.021) | 1952 (.157) |
| 10 | 1956 (.028) | 1957 (.173) |
Unsurprisingly, this team was bad and is infamous as the squad that served as Hayes' final team as coach. Ohio State had no No. 1 back to ride and no coherent offense around which to build. If the intuition is equally spreading rushing yards makes for a better offense, the 1978 season suggests the resulting "economy" looks more like Moldova than Sweden.
The trends become a little clearer for the successive coaching staffs. Rushing yards were most equally distributed in Earle Bruce's final season, a dumpster fire of a team that also served as Bruce's final roster in Columbus. Yards were more unevenly concentrated in the top back in 1983 and 1984, seasons in which Ohio State beat No. 2 Oklahoma and won the Fiesta Bowl (1983) or won the Big Ten (1984).
The Cooper years have some of the most unequal rushing outputs in program history in large measure because Cooper's offenses resembled what pro teams of the time aspired to have. There was a premier back (e.g. Eddie George) that Ohio State rode. The 1995 season, the most unequal rushing season in Ohio State's history, saw Eddie George account for an astounding 74% of all rushing production among the top four backs. He had more than five times the rushing yards as the team's No. 2 that season (Pepe Pearson). If Ohio State had a solid rushing defense (or, better yet, the 1996 defense with the 1995 offense), that team would be better lionized by Ohio State fans.
The 1989 season was Cooper's most equal among the top two rushers as Carlos Snow had 990 rushing yards and Scottie Graham added 977 rushing yards as the No. 2 back. However, that 1989 team was nothing special in the broad scheme of things, losing all four games it played against ranked teams that year.
These trends still bear out, minus a few methodological quibbles, from the Tressel years onward. Beanie Wells' 2007 season constitutes the second-most unequal rushing year in the data. The 2007 Buckeyes at least made the national championship game, which is more than can be said about more egalitarian years in 2004, 2009, and 2011. Even Urban Meyer's six years in Columbus bear this out. His most unequal rushing team was in 2014, the national championship year in which the Buckeyes discovered how great Ezekiel Elliott was. His most equal? The 2016 team that used J.T. Barrett counters/draws as security blankets and got shut out by Clemson.
The previous discussion was clearly cherry-picked, highlighting conspicuous cases in lieu of a more general assessment. The following table better supports the intuition here even though it does suggest that winning percentage does not necessarily increase much as Ohio State's offense more unequally concentrates rushing output in the No. 1 back.
| Category | Record |
|---|---|
| All Teams, 1946-2017 | 595-181-20 (.767) |
| Ten Lowest Gini Seasons (Top 2 Rushers) | 74-32-1 (.698) |
| Ten Lowest Gini Seasons (Top 4 Rushers) | 59-41-4 (.590) |
| Ten Highest Gini Seasons (Top 2 Rushers) | 95-28-1 (.772) |
| Ten Highest Gini Seasons (Top 4 Rushers) | 94-26-1 (.783) |
Ohio State's record in all games from 1946-2017, including the 2010 season because its nominally vacated status has no bearing on what we're doing here, is 595-181-20. The Buckeyes' record in the ten lowest Gini seasons, selecting on just the top two rushers, is 74-32-1. That's a .698 winning percentage even as that list includes the undefeated 1954 national championship team and the 2009 Big Ten and Rose Bowl championship team. Seasons in which rushing yards were more evenly spread among the top two backs coincide with a clear decrease in overall winning percentage.
The drop-off is more pronounced for the ten lowest Gini seasons selecting on the top four rushers. That winning percentage is .590, a substantial decrease. If Ohio State's record for all teams from 1946-2017 is basically a 9-3 record (i.e. 9/12 = .75), the ten lowest Gini seasons selecting on the year's top four rushers is basically a 7-5 team (i.e. 7/12 = .58).
Mike Weber returned to Ohio State with the idea he would get more carries and accrue more yards with J.T. Barrett gone. The resulting offense will, in all likelihood, feature Dwayne Haskins at quarterback. A far less mobile quarterback than Ohio State has had as a season-long starter since 2007, Weber stands to get more opportunities to form a "thunder and lightning" backfield in which both backs could conceivably rush close to or more than 1,000 yards.
It's not clear Ohio State fans should want this, though. This type of backfield recalls what made USC so explosive in 2005 but the data should dampen some enthusiasm for splitting yards and carries between Dobbins and Weber. If anything, Ohio State should hope one of the two emerges as the primary back because teams in which yards were spread more equally tend to be worse than the typical Ohio State team.


