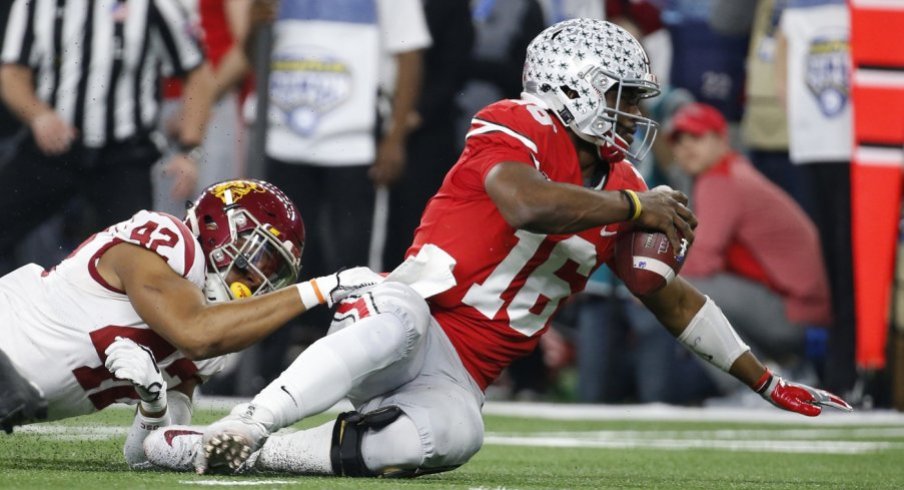
Despite entering the game with better season rankings in 15 of 18 key statistics including six of seven offensive metrics, the Buckeye offense put up a stinker but it was more than enough as the defense cranked out four turnovers in Ohio State's 24-7 win in a Cotton Bowl that was often tough on the eyes.
| YEAR | TOT OFF YDS | OPP | SCORE |
|---|---|---|---|
| 2012 | 236 | WISC | 21-14 (OT) |
| 2017 | 277 | USC | 24-7 |
| 2014 | 293 | PSU | 31-24 (OT) |
| 2015 | 298 | NIU | 20-13 |
| 2016 | 310 | MSU | 17-16 |
Facing the nation's 76th-ranked total defense and 97th-ranked pass defense, the Buckeye offense churned out just 277 total yards which looks to be the second-worst output among 73 wins since Urban Meyer took over the program back in 2012.
The gold standard remains the 236 yards tallied by the 2012 squad in a 21-14 overtime victory against Wisconsin.
The pedestrian total was aided by just 114 passing yards from Barrett on 11 completions. Both marks are season lows for the signal-caller excluding his three completions for 30 yards in an abbreviated performance against Michigan back in late November.
Other lopsided statistics on the night include:
3rd Down Conversions
Entering the season ranked No. 5 in the country with a 48.6% conversion rate, the Buckeyes converted just 2-of-12 third downs against the Trojans, good for 16.7%.
Barrett found Marcus Baugh for nine yards on a 3rd-and-6 and later found Austin Mack for 33 yards on a 3rd-and-8 for the only two conversions of the night.
Ohio State went a painful 0-for-5 on 3rd downs ranging in distance from 1-4 yards and gave up three sacks for -22 yards.
The run game failed to convert a single third down, rushing five times for 16 yards.
Total Offense Differential
While gaining only those 277 yards, the Buckeyes surrendered 413 including 356 through the air meaning the good guys were outgained by 136 total yards.
First Downs
The Buckeyes racked up just 13 first downs on the night while giving up 23.
Ohio State entered the Cotton Bowl averaging 26.2 first downs per game, good for 4th nationally while giving up 16.3, good for 13th in the land.
Total Plays
Ohio State ran 22 plays in the first quarter but totaled just 33 more over the final three quarters to finish with 55 total plays. The Trojans totaled just 14 plays in the first quarter but ran 67 over the final three quarters to finish with 81.
Both teams averaged right around 5.0-5.1 yards per play.
While the offensive performance left a lot to be desired from a statistical standpoint, the stats that mattered most were turnovers and points off turnovers and thankfully for Ohio State, its defense dominated.
The Buckeye defense racked up four turnovers leading to 21 points while the Trojans managed to force just one turnover for seven points.
That's all Ohio State needed to register a 24-7 win despite the anemic offensive output.


